



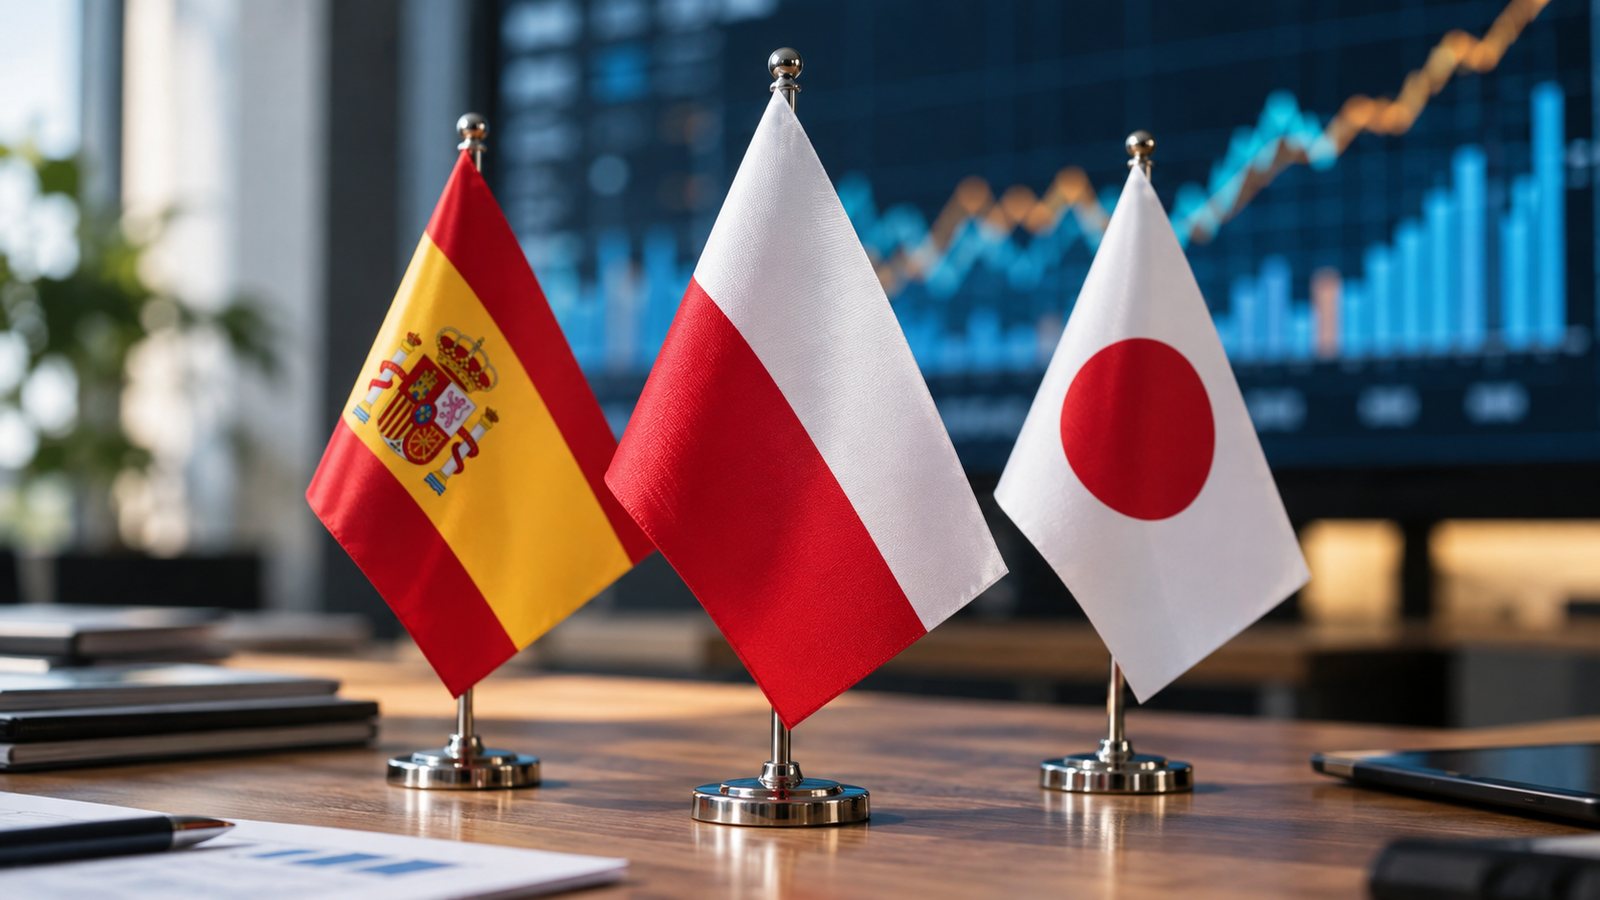
Poland is close to catching up with Spain on one of the measures used to compare countries’ economic standing. International Monetary Fund projections for 2026 put its GDP per capita, adjusted for purchasing power parity, at 60,051 international dollars, compared with 60,106 for Spain and 59,712 for Japan. The gap with the Spanish economy would be just 0.1%.
The comparison encapsulates a transformation that began with the country’s exit from the planned economy in the early 1990s. It also requires an important caveat: the 2026 figures are forecasts, and the indicator adjusts for price differences across countries. It does not mean that Poles earn more than Japanese people or have virtually the same incomes as Spaniards.
Purchasing power parity makes it possible to compare the volume of goods and services produced per capita by taking into account their cost in each economy. It is expressed in international dollars, a statistical unit with purchasing power equivalent to that of the U.S. dollar in the United States.
From restructuring to European integration
Poland’s path began with a difficult economic rupture. The reform program introduced in January 1990, known as the Balcerowicz Plan, drove price liberalization, trade opening, and the transition to a market economy. The stabilization process was initially accompanied by a sharp decline in economic activity, employment, and real wages.
The World Bank attributes the subsequent development to a combination of reforms and institutions: protection of property rights, competition, macroeconomic stability, and integration with international markets. The creation of private businesses and the transformation of the regulatory framework gradually built an economy different from the one inherited from the communist system.
Accession to the European Union in 2004 reinforced that process. Access to the single market, foreign investment, and EU funding supported the modernization of production and infrastructure. An IMF study published in 2026 says Polish per capita income rose from 34% of the average for a group of 14 EU economies in the mid-1990s to 78% in 2025.
Education and the ability to absorb technology have also contributed to the progress. According to the OECD, an educated population and an environment conducive to business activity helped attract investment and new businesses.
What explains the comparison with Japan and Spain
The convergence reflects different economic trajectories. Poland has had room to raise productivity through investment, technology transfer, and modernization. Japan, an advanced economy for much longer, faces challenges in accelerating growth and an aging population that constrains the labor supply.
In Spain’s case, a projected gap of 55 international dollars is too small to be presented as an established economic divide. What matters is the proximity Poland has achieved after decades of growth from a far lower starting point.
Sustaining that progress will require changes. The IMF warns that technology transfer loses momentum as a growth driver as an economy approaches the productivity frontier. Poland needs to strengthen homegrown innovation while confronting aging, labor shortages, and pressure on public finances.